Statistics in the voucher system
In this article
In the Statistics section you get an overview of your sales and can analyse them depending on the selected time period and evaluation type. The data is displayed as key figures and charts. Regular analyses of sales figures are important to measure the long-term success of your online shop, identify seasonal fluctuations and make informed decisions for marketing and sales.
Voucher sales
Select a time period

Key figures (overview)
- Total CHF / EUR sales (total revenue)
- Number of vouchers (number of vouchers sold)
- Average price (average value per voucher)

Point of sale
- Online shop
- On site / local

Delivery method (orders from the online shop)
- print@home
- Postal delivery and pick-up on site

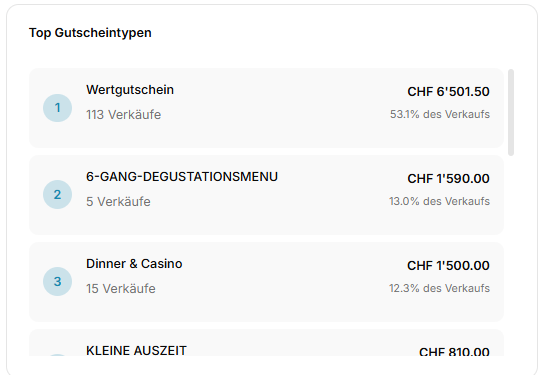
Best-selling voucher types
- Number of sales
- Revenue per voucher type
- Share of total revenue
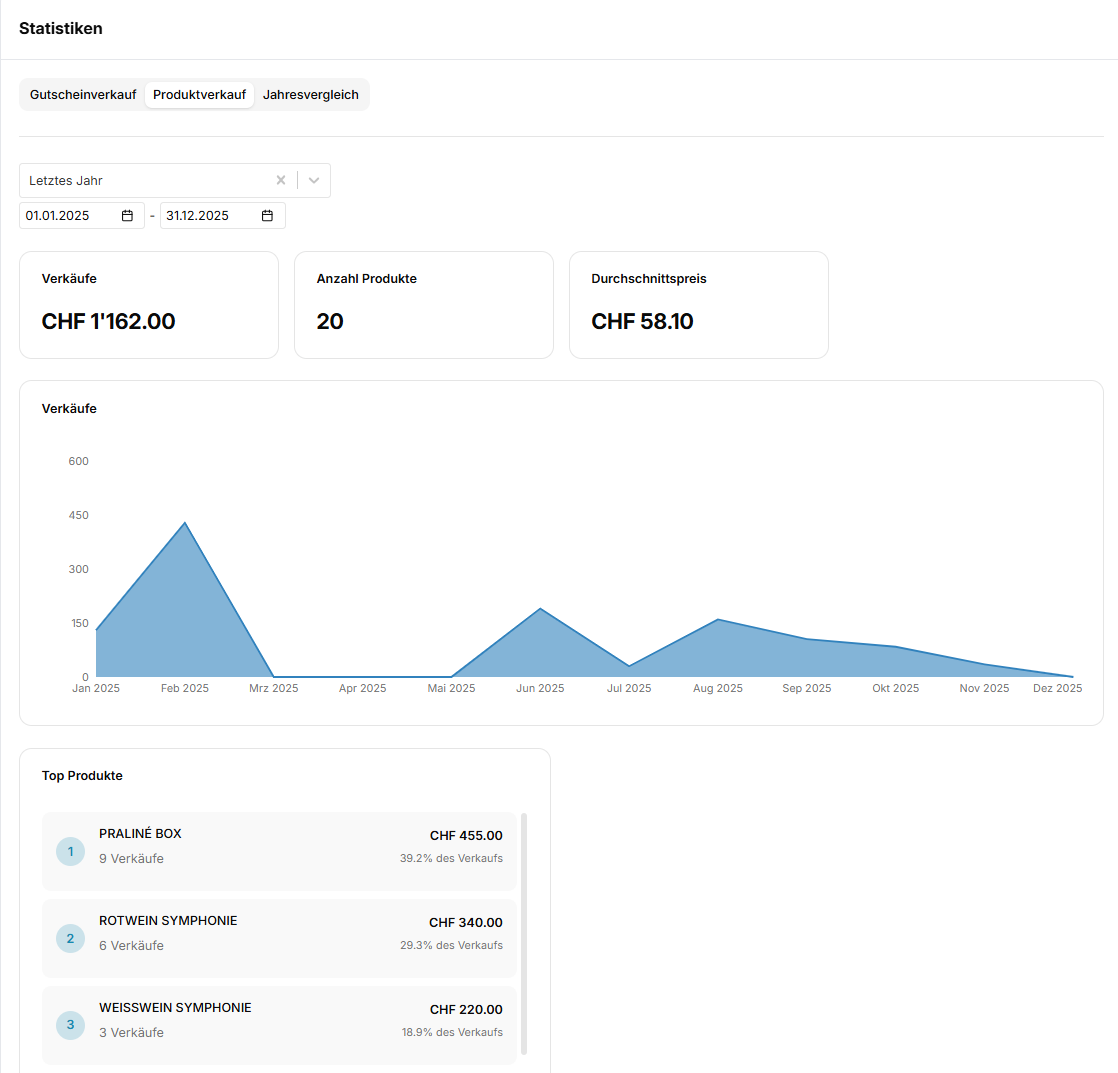
Product sales
In the Product salestab you will find the same analysis as for voucher sales – but relating to your products.
Here too, for the selected period, revenue, number of sales and average price are displayed and shown graphically, as well as the top products and their share of total sales of vouchers and products.
Year comparison
In the Year comparisontab you can compare your sales over several years. This is especially helpful to monitor long-term sales development and identify changes.
